Demystifying Stein's Paradox
A quick insight in shrinkage estimation
Stein’s paradox
Stein’s example, perhaps better known under the name Stein’s Paradox, is a well-known example in statistics that demonstrates the use of shrinkage to reduce the mean squared error (\(L_2\)-risk) of a multivariate estimator with respect to classical (unbiased) estimators, such as the maximum likelihood estimator. It is named after Charles Stein who originally introduced this phenomenon in (Stein 1956), and it is seen as an important contribution to the field of statistics, with grand mentions of Stein’s paradox online, such as:
In the words of one of my professors, “Stein’s Paradox may very well be the most significant result in Mathematical Statistics since World War II.”1
This seems like a fairly bold claim, but it is nonetheless an enlightening example as its setup is easy to grasp and the result is quite counter-intuitive at first sight. In its simplest form, Stein’s example can be stated as follows:
Let \(X_1, \ldots, X_p\) be independent random variables, such that \(X_i \sim N(\theta_i, 1)\) for each \(i = 1, \ldots, p\). Now, our goal is to estimate the unknown parameters \(\theta_1, \ldots, \theta_p\). Since we have only one noisy measurement of each \(\theta_i\), an obvious choice of estimator is \(\hat{\theta}_i = X_i\) for each \(i\). So far nothing special, but now the interesting part follows…
If the quality of the estimator is measured by its mean squared error:
\[ \mathbb{E}\left[ \Vert \hat{\boldsymbol{\theta}} - \boldsymbol{\theta} \Vert^2 \right] \ = \ \sum_{i = 1}^p \mathbb{E}\left[ (\hat{\theta}_i - \theta_i)^2 \right], \] then it turns out that this obvious estimator is inadmissible (i.e. suboptimal) whenever \(p \geq 3\) in the sense that we can find a different estimator that always achieves a lower mean squared error, no matter what the value of \(\boldsymbol{\theta}\) is.
Moreover, such an estimator does not only exist in theory, (James and Stein 1961) derive the following explicit form of an estimator that strictly dominates \(\hat{\boldsymbol{\theta}}\) in terms of the mean squared error2:
\[ \hat{\boldsymbol{\theta}}_{JS} = \left( 1 - \frac{p - 2}{\Vert \boldsymbol{X} \Vert^2}\right) \boldsymbol{X} \]
Taking a closer look at the James-Stein estimator, it is seen that it shrinks the initial estimator (\(\boldsymbol{X}\)) towards the origin3 by multiplication with a certain shrinkage factor that is proportional to the norm of \(\boldsymbol{X}\) and the dimension \(p\). This certainly seems surprising and for Stein’s audience perhaps even paradoxical: given a set of individual noisy observations with means \(\theta_1, \ldots, \theta_p\), instead of taking the individual observations as estimators of \(\theta_1, \ldots, \theta_p\), we can apparently obtain a better estimator by moving the observations towards some arbitrary point in the space, in this case the origin. How to make sense of this?
Bias-Variance tradeoff
The key insight to make this phenomenon intuitive is to understand that we asses the quality of the estimator by the combined mean squared errors of all \(\theta_i\)’s, i.e. \(\sum_{i = 1}^p \mathbb{E}[(\hat{\theta_i} - \theta_i)^2]\). If we were to assess the quality of the estimator based only on the mean squared error of a single \(\theta_i\), no shrinkage estimator will in fact be able to uniformly dominate \(\hat{\theta}_i = X_i\). However, since we focus on the mean squared error across all \(\theta_i\)’s, it turns out we can do slightly better by reducing the variance of the estimator at the cost of adding some bias. I feel that in some of the online sources I came across before writing this post, this point is not nearly stressed enough (or not even mentioned at all). Especially in the context of modern statistics and machine learning, where bias-variance trade-offs play a key role (an aspect in which Stein may have played a part himself), I believe that Stein’s paradox is an excellent demonstration of how giving up unbiasedness allows one to achieve better estimators in terms of mean squared error.
Before we make some plots to visualize the previous insights, recall that we can always decompose the mean squared error into (1) a squared bias term and (2) a variance term, the derivation of which only relies on the linearity of the expectation:
\[ \sum_{i = 1}^p \mathbb{E}\left[(\hat{\theta}_i - \theta_i)^2 \right] \ = \ \sum_{i = 1}^p \left(\mathbb{E}[\hat{\theta}_i] - \theta_i \right)^2 + \sum_{i = 1}^p \mathbb{E}\left[(\hat{\theta_i} - \mathbb{E}[\hat{\theta_i}])^2\right] \] The estimator \(\hat{\boldsymbol{\theta}} = \boldsymbol{X}\) satisfies \(\mathbb{E}[\hat{\boldsymbol{\theta}}] = \boldsymbol{\theta}\) so the first term drops out, and the second term is equal to \(p\) due to our assumption that \(\text{var}(X_i) = 1\) for each \(i\). So far so good, now let’s define a general shrinkage estimator of the form \(\hat{\boldsymbol{\theta}}_{\lambda} = \lambda \boldsymbol{X}\). It is straightforward to write out the squared bias and variance terms explicitly for any given \(\lambda \in \mathbb{R}\):
\[ \sum_{i = 1}^p \mathbb{E}\left[(\hat{\theta}_{\lambda, i} - \theta_i)^2 \right] \ = \ \underbrace{(\lambda - 1)^2 \Vert \boldsymbol{\theta} \Vert^2}_{\text{Bias}^2} + \underbrace{\lambda^2 \cdot p}_{\text{Variance}} \]
Taking a closer look at the right-hand side, we see that for any given \(\lambda\), the variance term only depends on the dimension \(p\), and the bias term only depends on the norm (i.e. size) of \(\boldsymbol{\theta}\). At one end of the spectrum, if \(\lambda = 1\), we retrieve our original estimator \(\hat{\boldsymbol{\theta}}_1 = \boldsymbol{X}\), which has zero bias and maximal variance. At the other end of the spectrum, if \(\lambda = 0\), the estimator reduces to a constant \(\hat{\boldsymbol{\theta}}_0 = \boldsymbol{0}\), which has zero variance but an arbitrarily large bias.
The mean squared error of the general shrinkage estimator \(\hat{\boldsymbol{\theta}} = \lambda \boldsymbol{X}\) across a range of different values for \(\lambda\) is visualized in the animated plot below. From left to right the dimension \(p\) is varied between \(p = 1, 3, 5\), which only affects the variance term of \(\hat{\boldsymbol{\theta}}_{\lambda}\) and not its bias. In contrast, going through the animation \(\Vert \boldsymbol{\theta} \Vert\) ranges from 0 to 3, which only has an impact on the bias of \(\hat{\boldsymbol{\theta}}_\lambda\), whereas the variance term remains unaffected. As the size of \(\boldsymbol{\theta}\) and the dimension \(p\) vary, the optimal amounts of shrinkage \(\lambda^*\) that minimize the mean squared error (indicated by the red dots) evolve by moving towards \(\lambda = 1\) as \(\Vert \boldsymbol{\theta} \Vert \to \infty\) at different speeds for different values of \(p\):
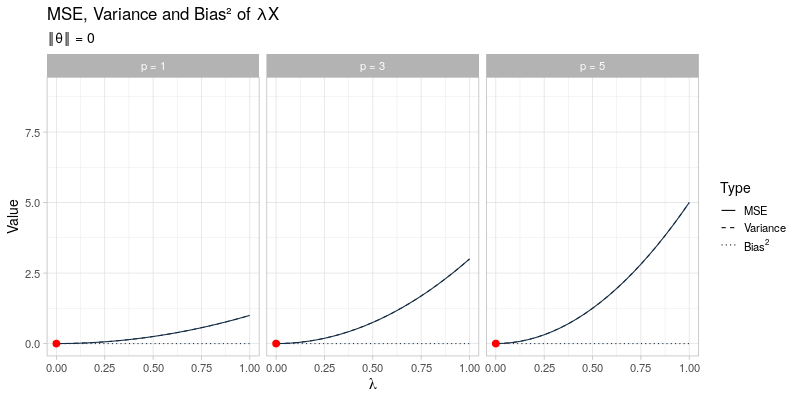 This visualization effectively illustrates why shrinkage becomes more effective (i.e. choosing a smaller value for \(\lambda\)) as the dimension \(p\) becomes larger by reducing the variance at the cost of adding some additional bias. Recall that the James-Stein estimator only strictly dominates the unbiased estimator \(\hat{\boldsymbol{\theta}} = \boldsymbol{X}\) for \(p \geq 3\).
On the other hand, the visualization also demonstrates that for larger values of \(\Vert \boldsymbol{\theta} \Vert\), the applied amount of shrinkage should become smaller (i.e. using a larger value for \(\lambda\)), thereby opting for a small bias term at the cost of a larger variance. Essentially, this is exactly what the James-Stein estimator tries to do:
\[ \hat{\boldsymbol{\theta}}_{JS} = \left( 1 - \frac{p - 2}{\Vert \boldsymbol{X} \Vert^2}\right) \boldsymbol{X} \] For larger values of \(p\), \(\lambda = 1 - \frac{p - 2}{\Vert \boldsymbol{X} \Vert^2}\) decreases (potentially even becoming negative, which is actually not what we want and suggests why the positive-part James-Stein estimator might still lead to an improvement). For larger values of \(\Vert \boldsymbol{\theta} \Vert\), the shrinkage factor \(\lambda\) should move towards 1. The actual value of \(\Vert \boldsymbol{\theta} \Vert\) is unknown given only \(\boldsymbol{X}\), but since \(\boldsymbol{X}\) itself is centered around \(\boldsymbol{\theta}\), the term \(\frac{1}{\Vert \boldsymbol{X} \Vert^2}\) in the shrinkage factor can be understood to serve as a proxy4 for \(\frac{1}{\Vert \boldsymbol{\theta} \Vert^2}\). This way, the shrinkage factor \(\lambda\) will be approximately equal to 1 for large values of \(\Vert \boldsymbol{X} \Vert\).
Finally, it also becomes intuitive why the choice of the shrinkage target does not actually matter and can be set to any \(\boldsymbol{\theta}_0 \in \mathbb{R}^p\) instead of the origin. The mean squared error of the generalized shrinkage estimator \(\hat{\boldsymbol{\theta}}_{\theta_0, \lambda} = \boldsymbol{\theta}_0 + \lambda (\boldsymbol{X} - \boldsymbol{\theta}_0)\) is simply:
\[ \sum_{i = 1}^p \mathbb{E}\left[(\hat{\theta}_{\theta_0, \lambda, i} - \theta_i)^2 \right] \ = \ (\lambda - 1)^2 \Vert \boldsymbol{\theta} - \boldsymbol{\theta}_0 \Vert^2 + \lambda^2 \cdot p \] And exactly the same bias-variance tradeoffs as before apply. In particular, the James-Stein estimator with a non-trivial shrinkage target \(\boldsymbol{\theta}_0\) becomes:
\[ \hat{\boldsymbol{\theta}}_{JS, \theta_0} = \boldsymbol{\theta}_0 + \left( 1 - \frac{p - 2}{\Vert \boldsymbol{X} - \boldsymbol{\theta}_0 \Vert^2}\right) (\boldsymbol{X} - \boldsymbol{\theta}_0) \]
References
James, W., and C. Stein. 1961. “Estimation with Quadratic Loss.” Proceedings of the Fourth Berkeley Symposium on Mathematical Statistics and Probability 1: 361–79. https://projecteuclid.org/euclid.bsmsp/1200512173.
Stein, C. 1956. “Inadmissibility of the Usual Estimator for the Mean of a Multivariate Normal Distribution.” Proceedings of the Third Berkeley Symposium on Mathematical Statistics and Probability 1: 197–206. https://projecteuclid.org/euclid.bsmsp/1200501656.
it turns out the James-Stein estimator itself is also inadmissable, as it is dominated by the positive-part James-Stein estimator \(\hat{\boldsymbol{\theta}}_{JS+} = \left( 1 - \frac{p - 2}{\Vert \boldsymbol{X} \Vert^2}\right)_+ \boldsymbol{X}\).↩︎
there is nothing special about the origin in particular and we could shrink just as well towards an arbitrary vector \(\boldsymbol{\theta}_0 \in \mathbb{R}^p\).↩︎
note that \(\frac{1}{\Vert \boldsymbol{X} \Vert^2}\) is not an unbiased estimator of \(\frac{1}{\Vert \boldsymbol{\theta}\Vert^2}\)↩︎